A polynomial function has the form f(x)=anxn + an-1xn-1 + an-2xn-2 + ... + a0x0. In this function the a's are constants and an just means that an goes with xn and a different a goes with xn-1 and so forth with declining powers of x until you get to x to the zero power, which is a constant. The n is a positive integer and we will later relate it to the degree of the function/equation. We will consider polynomials in the next section.
In this section we are going to look at a function that is more limited than a polynomial in some sense and more expansive in other ways. We will focus on a function that has a single value of n and a. We will call a function of this form, f(x)=kxp, a power function. (Note I have used the letters k and p instead of a and n because these are the letters used by the text.) For the power function k is a constant, and may be positive or negative and an integer or a mixed number or a fraction. Similarly p may be positive or negative and it may also be an integer, or a mixed number or a fraction. You are already familiar with some forms of the power function. For example:
- k = m, p = 1 : f(x) = kx1, This is the equation of a straight line
- k = a (some number), p = 2 : f(x) = ax2, This is a quadratic function (parabola)
- k = a (some number), p = 3 : f(x) = ax3, This is a cubic function
In general if the power function has an even integer value of p it will look a lot like a parabola. The function will be even and the resulting graph will be symmetric about the y axis. The figure below shows the general situation for p = 2 and 4. The larger the value of p the narrower the graph and the faster the function rises with increasing values of x.
If the power function has an odd integer exponent it will look a lot like a cubic but will become positive and negative more rapidly as x increases (see second figure below). The function will be odd and it will be symmetric about the origin.
If the power p is negative we get a different type of graph. Two examples are shown below. In the first case f(x)=x-1 we a graph that represents an odd function (symmetric about the origin). In the second case shown f(x)=x-2 we get a graph that represents an even function that is symmetric about the y axis.
To check the graphs shown below try entering the equations in your calculator and looking at the graphs. You can enter the equations in the "Y=" area of your calculator. For the window setting ZSTANDARD should give you a useful view of the graph.

Up to now we have discussed the behavior of the power function in the long run (as x gets very positive or very negative). Now we want to look at the behavior of these functions when x is between -1 and +1. For simplicity we will look at the first quadrant situation (x from 0 to +1) and power functions with k = 1 and p = 2 and 4. The figure below gives the graphs between 0 and 1 (not necessarily to scale) or f(x) = x2 and f(x) = x4. For x greater than 1 it is evident that x4 will be larger than x2. However, when x is between 0 and 1 the x2 graph is higher than the x4. If you think about this for a minute it should make sense. If we square a fraction, say 0.5 we get a smaller number, in this case 0.25. If we take 0.5 to the fourth power we get an even smaller number, 0.0625. So, in the short run, between 0 and 1 the x squared curve is above the x to the fourth graph. After that the x to the fourth graph dominates.

Determining the equation of a power function
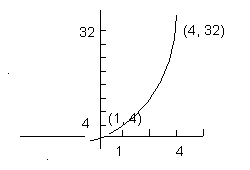
Can we determine the equation of a power function from two points? Fortunately the answer is yes we can. Consider the figure on the right. f(x) is a power function that goes through the points (2, 32) and (1,4). Since we know it is a power function we can use both points to write its equation:

- Using (2, 32): f(x) = 32 = k(2)p
- Using (1, 4): f(x) = 4 = k(1)p (since 1 to any power is 1) this gives us k = 4
- Substituting k= 4 in the first equation gives: 32 = 4(2)p
- Dividing both sides of the equation by 4 gives: 32/4 = 8 = 2p
- The only way (2)p can equal 8 is if p = 3
- Our power function must be f(x) = 4(x)3