Graphing The Other Trigonometric Functions
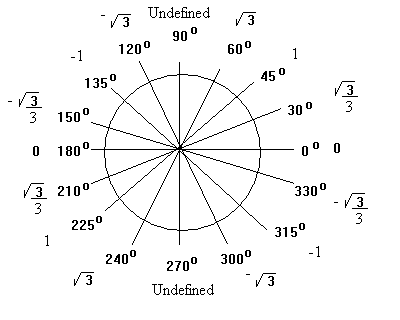
Graphing the Tangent Function - As a first step we will go around the circle and generate values of the tangent function by taking the ratio of the sine (y) to the cosine (x). Because certain angles have especially nice answers, that textbook writters seem to like, we will use angles that relate to 30o and 45o. The table shown below gives the decimal values of tan(A), sin(A) and cos(A) for selected angles and the graph to its right shows the exact (not decimal) values of the trigonometric function as you go around the unit circle. Remember for a unit circle the x coordinate of a point is the cosine, the y coordinate of a point is the sine and the ratio of y to x is the tangent..
From the table and the graph we can observe a number of things. First, the range of the tangent goes from -infinity to + infinity. Secondly we can observe that when x = Pi/2 and 3 Pi/2 the value of is undefined, the function has a vertical asymptote every Pi units. Starting at Pi/2 and going in the positive and negative directions along the number line.

| Angle | Sine(A) | Cosine(A) | Tangent |
|---|---|---|---|
| 0o | 0.0 | 1.0 | 0.0 |
| 30o | 0.50 | 0.8660 | 0.5574 |
| 45o | 0.7071 | 0.7071 | 1.0 |
| 60o | 0.8660 | 0.50 | 1.7321 |
| 90o | 1.0 | 0.0 | Undefined |
| 120o | 0.8660 | -0.50 | -1.7321 |
| 135o | 0.7071 | -0.7071 | -1.0 |
| 150o | 0.5 | -0.8660 | -0.5774 |
| 180o | 0.0 | -1.0 | 0.0 |
| 210o | -0.50 | -0.8660 | 0.5774 |
| 225o | -0.7071 | -0.7071 | 1.0 |
| 240o | -0.8660 | -0.50 | 1.7321 |
| 270o | -1.0 | 0.0 | Undefined |
| 300o | -0.8660 | 0.50 | -1.7321 |
| 315o | -0.7071 | 0.7071 | -1.0 |
| 330o | -0.50 | 0.8660 | -0.5774 |
The figures shown below provide views of the graphs of the tangent and cotangent functions. Since the cotangent is defined as 1/tangent wherever the tangent is zero the cotangent is undefined and wherever the tangent is undefined the cotangent is zero.
| Graph of Tangent | Graph of Cotangent |
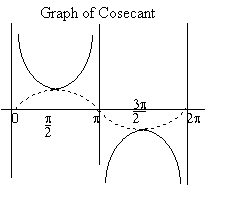
 The figure on the right shows a graph of the sine function and the cosecant function. The two functions are related by the relationship csc(A) = 1/sin(A). When sin(A) = 0 the csc(A) is undefined. In the figure there are vertical lines to show that the cosecant has a vertical asymptote (the lines are not really part of the graph but I believe they make what is happending clearer). Thus there will be vertical asymptotes every Pi units along the positive and negative x axis starting at the origin. When sin(A) = 1 csc(A) = 1/1 =1 so the curves are tangent whenever the sine function is at a high point or a low point. Since this happens every Pi units starting at Pi/2 in the positive direction there will tangent points at Pi/2, 3*Pi/2, 5*Pi/2, etc... In the negative direction there will be tangent points at -Pi/2, -3*Pi/2, -5*Pi/2, etc...
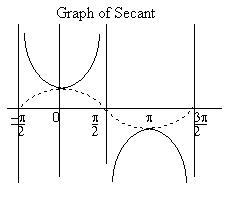
 The figure on the right shows a graph of the cosine function and the secant function. The two functions are related by the relationship sec(A) = 1/cos(A). When cos(A) = 0 the sec(A) is undefined. In the figure there are vertical lines to show that the secant has a vertical asymptote (the lines are not really part of the graph but I believe they make what is happending clearer). Thus there will be vertical asymptotes every Pi units along the positive and negative x axis starting at the origin, starting at Pi/2 in the positive direction there will tangent points at Pi/2, 3*Pi/2, 5*Pi/2, etc... In the negative direction there will be tangent points at -Pi/2, -3*Pi/2, -5*Pi/2, etc...When cos(A) = 1 sec(A) = 1/1 =1 so the curves are tangent whenever the cosine function is at a high point or a low point. Since this happens every Pi units starting at the origin, in the positive direction there will tangent points at Pi, 2Pi, 3Pi, etc... In the negative direction there will be tangent points at -Pi, -2Pi, -3Pi, etc...