Graphing the Sine and Cosine Functions
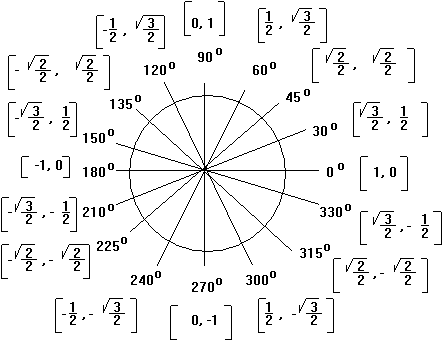
Graphing the Sine Function - As a first step we will go around the circle and generate values of the sine and cosine functions. Because certain angles have especially nice answers, that textbook writters seem to like, we will use angles that relate to 30o and 45o. The table shown below gives the decimal values of sin(A) and cos(A) for selected angles and the graph to its right shows the exact (not decimal) values of the trigonometric function as you go around the unit circle. Remember for a unit circle the x coordinate of a point is the cosine and the y coordinate of a point is the sine.
From the table and the graph we can observe a number of things. First, both the sine and the cosine vary between -1 and +1. The "range" of the sine and cosine functions is from -1 to +1, while the domain includes all x axis values. Secondly we can observe that when x = 0 the value of the sine is 0. Thus a graph of the sine function will start at the origin, increase until it reaches 1, then decrease to 0, then go negative to -1 and finally go back to 0 again.
For the sine function we note that when x = 0 the sine function is on the midline (x axis in this case). As x increases the function increases reaching 1 at 90o. The sine then decreases reaching 0 at 180o after which it becomes negative finally reaching -1 at 270o. From then to 360o the sine increases until it is back to 0o.
For the cosine function we note that when x = 0 the cosine function is at a maximum, 1. As x increases the function decreased reaching 0 at 90o. The cosine then becomes negative reaching -1 at 180o after which it stays negative but gets closer to 0, finally reaching 0 at 270o. From then to 360o the cosine becomes positive and increasing.
| Angle | Sine(A) | Cosine(A) |
|---|---|---|
| 0o | 0.0 | 1.0 |
| 30o | 0.50 | 0.8660 |
| 45o | 0.7071 | 0.7071 |
| 60o | 0.8660 | 0.50 |
| 90o | 1.0 | 0.0 |
| 120o | 0.8660 | -0.50 |
| 135o | 0.7071 | -0.7071 |
| 150o | 0.5 | -0.8660 |
| 180o | 0.0 | -1.0 |
| 210o | -0.50 | -0.8660 |
| 225o | -0.7071 | -0.7071 |
| 240o | -0.8660 | -0.50 |
| 270o | -1.0 | 0.0 |
| 300o | -0.8660 | 0.50 |
| 315o | -0.7071 | 0.7071 |
| 330o | -0.50 | 0.8660 |
The figures shown below are graphs of the sine (left-hand figure) and cosine (right-hand figure) functions.