Graphs of Exponential and Logarithmic Functions
In this you will look at graphing logarithmic and exponential functions. Why are we treating these two at the same time?. One good reason is that they are related. First remember that log without an indicated base means base 10 (log10). Next recall that we said that y = log(x) can be written as x = 10y. One expression is in log form while the other is in exponential form.
Before we start calculating values and graphing them you also need to refresh your understanding of the treatment of exponents.
- The first thing to remember is y=x-n is the same as y = 1/xn.
- The second rule to remember is y= [xm]n is the same as y = xmn
Exponential Functions
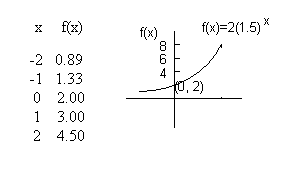
 These are functions of the form y = abx. The figure on the right shows a graph of the function f(x) = 2(1.5)x. This is an increasing function (goes up as we move from left to right along the number line) and it is concave up. The table next to the figure gives selected values of x and f(x) (f(x) is the y axis coordinate of the graph). Note that the function is never negative. When x is negative you are taking 1.5 to a negative power which is the same as saying one over 1.5 to a power. For example: 1.5-2 is the same as 1/1.52. For very negative values of x the value of the function approaches 0 (the x axis). Thus as x gets more negative the curve is asymptotic to the x axis (the line y = 0). As x gets larger in the positive direction the value of f(x) continually grows.
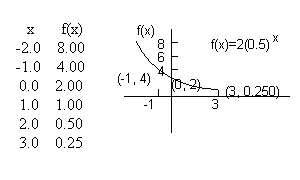
 The figure on the right shows a graph of an exponential function that is concave up and decreasing as you go from left to right along the number line. The table next to the figure gives selected values of x and f(x). As was true for the previous exponential function the y axis value is never negative. For negative values of x the function is large but as x approaches zero and becomes positive the function is constantly decreasing in value. The function is asymptotic to the x axis (the line y = 0). In this case this means that as x approaches positive infinity the value of the function approaches zero.
Base 10 - Common Logarithms
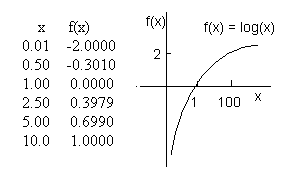
 The symbol log without an indicated base means base 10 (log10). The log of a number tells us the power of 10 we would need to get that number. For example log(100) = 2 means that we would have to square 10 to get 100 (102=100). Given this meaning is it possible for the log of a number of give us a negative answer? Yes, it is possible. For example if you were taking the log of 0.01 you are asking what power do I take 10 to for the answer to be 0.01 (one one-hundredth or 1/100). The answer is that you take 10 to the -2 power. 10-2=0.10 so log(0.01) = -2. Clearly for numbers greater than 1 the log of a number will be positive. However, for numbers between zero and 1 the log will be negative and the smaller the number the bigger the negative number (try some on your calculator). If the result of taking a log can be negative can we also take the log of a negative number such as log(-3)? This would ask what power of 10 gives us a -3? There is no power of 10 that can change the sign of a number from positive to negative. 10 to any power will always have a positive result. So, we cannot take logs of negative numbers. If you have an advanced calculator and you take the log of a negative number you may get a two part answer. The calculator is not answering the question you think you have asked it. It is giving you an answer in the complex domain and we are only operating with real numbers. If you get a two-part answer when taking a log it means that there is no "real" result (or that you have made a typing error which is also possible). So, the domain of log(x) is x > 0.
Base e - Natural Logarithms
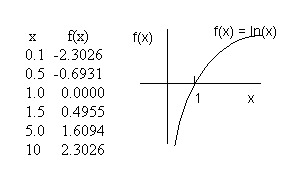
 Just as the symbol log without an indicated base has a special meaning so the symbol ln has a special meaning. If you see the symbol ln it means base e (where e is the number 2.7183....). The ln of a number to the base e tells us the power of e that would give us that number. For example ln(4) = 1.3863 (to four decimal places) tells us that we would have to take e to the 1.3863 power to get 4. If you try this on your calculator you would have: e1.3863 = 4.00 which is what we believed would happen. Just as the case was with log, ln of a number will yield negative numbers if the number is between 0 and 1. Ln 0.5 = -0.6931 which means e-0.6931 = 0.5. In addition just as it was with log you cannot take the ln of a negative number. There is no power of e that will change a number from positive to negative. As was the case with log if your calculator does give you an answer (two part answer) it is assuming that you are dealing with a problem involving complex numbers. Since this course deals only with "reals" the answer does not apply to work for this course. So, the domain of ln(x) is x > 0
Logarithmic Scales
| Animal | Body Mass (kg) | Log(Body Mass) |
| Blue Whale | 91000 | 4.9590 |
| African Elephant | 5450 | 3.7364 |
| White Rhinoceros | 3000 | 3.4771 |
| Hippopotamus | 2520 | 3.4014 |
| Black Rhinoceros | 1170 | 3.0682 |
| Horse | 700 | 2.8451 |
| Lion | 180 | 2.2553 |
| Human | 70 | 1.8451 |
| Albatross | 11 | 1.0414 |
| Hawk | 1 | 0.0000 |
| Robin | 0.08 | -1.0969 |
| Hummingbird | 0.003 | -2.5229 |
You are probably used to linear scales on your graphs. You can also have logarithmic scales. In the material that follows we will look at those scales and see how they might portray some data. The data that will be used is shown to the right: The data relates to the body mass of various animals. The last column of the table contains the value of the common logarithm (log) of the animal's body mass. Note that the logarithm values go from a low of -2.5229 to a high of 4.9590. The values of log(Body mass) tell us the power of 10 we need to get the body mass of the animal.
We can plot this data on a linear scale that goes from 0.003 kg to 91,000 kg and fits on one page. Such a scale is shown below. Note that only two of the data points are easily read. The Blue Whale and the African Elephant are easily portrayed on the linear scale. All of the other points fall between the zero point and the first division of the scale (5,000 kg). If we put the actual points in there it would be very difficult to separate which point goes with which animal. The large number of data points on the left end of the scale have been indicated by the word "many".

If we plot the logarithm of the Body mass data using a logarithmic scale we get the figure shown below. Note that we are able to get all the points in our graph, there is spacing between most points and we don't have all of the points bunched up at the low end of the scale. For these reasons logarithmic scales can be used to great advantage when there is a large variation in data values.

 These are functions of the form y = abx. The figure on the right shows a graph of the function f(x) = 2(1.5)x. This is an increasing function (goes up as we move from left to right along the number line) and it is concave up. The table next to the figure gives selected values of x and f(x) (f(x) is the y axis coordinate of the graph). Note that the function is never negative. When x is negative you are taking 1.5 to a negative power which is the same as saying one over 1.5 to a power. For example: 1.5-2 is the same as 1/1.52. For very negative values of x the value of the function approaches 0 (the x axis). Thus as x gets more negative the curve is asymptotic to the x axis (the line y = 0). As x gets larger in the positive direction the value of f(x) continually grows.
 The figure on the right shows a graph of an exponential function that is concave up and decreasing as you go from left to right along the number line. The table next to the figure gives selected values of x and f(x). As was true for the previous exponential function the y axis value is never negative. For negative values of x the function is large but as x approaches zero and becomes positive the function is constantly decreasing in value. The function is asymptotic to the x axis (the line y = 0). In this case this means that as x approaches positive infinity the value of the function approaches zero.
 The symbol log without an indicated base means base 10 (log10). The log of a number tells us the power of 10 we would need to get that number. For example log(100) = 2 means that we would have to square 10 to get 100 (102=100). Given this meaning is it possible for the log of a number of give us a negative answer? Yes, it is possible. For example if you were taking the log of 0.01 you are asking what power do I take 10 to for the answer to be 0.01 (one one-hundredth or 1/100). The answer is that you take 10 to the -2 power. 10-2=0.10 so log(0.01) = -2. Clearly for numbers greater than 1 the log of a number will be positive. However, for numbers between zero and 1 the log will be negative and the smaller the number the bigger the negative number (try some on your calculator). If the result of taking a log can be negative can we also take the log of a negative number such as log(-3)? This would ask what power of 10 gives us a -3? There is no power of 10 that can change the sign of a number from positive to negative. 10 to any power will always have a positive result. So, we cannot take logs of negative numbers. If you have an advanced calculator and you take the log of a negative number you may get a two part answer. The calculator is not answering the question you think you have asked it. It is giving you an answer in the complex domain and we are only operating with real numbers. If you get a two-part answer when taking a log it means that there is no "real" result (or that you have made a typing error which is also possible). So, the domain of log(x) is x > 0.
 Just as the symbol log without an indicated base has a special meaning so the symbol ln has a special meaning. If you see the symbol ln it means base e (where e is the number 2.7183....). The ln of a number to the base e tells us the power of e that would give us that number. For example ln(4) = 1.3863 (to four decimal places) tells us that we would have to take e to the 1.3863 power to get 4. If you try this on your calculator you would have: e1.3863 = 4.00 which is what we believed would happen. Just as the case was with log, ln of a number will yield negative numbers if the number is between 0 and 1. Ln 0.5 = -0.6931 which means e-0.6931 = 0.5. In addition just as it was with log you cannot take the ln of a negative number. There is no power of e that will change a number from positive to negative. As was the case with log if your calculator does give you an answer (two part answer) it is assuming that you are dealing with a problem involving complex numbers. Since this course deals only with "reals" the answer does not apply to work for this course. So, the domain of ln(x) is x > 0

