A single value that summarizes a set of data. It locates the center of the values.
Arithmetic Mean - Population mean is a Parameter of the population. Sample mean is a Statistic and is frequently used to estimate the population mean. To calculate the mean total all of the data values and divide that total by the number of data points.
- Properties of the arithmetic mean
- Interval and ratio data sets have an arithmetic mean
- All of the values are used in computing the mean
- A set of data has only one mean. (Unique)
- Can be used to compare two or more populations.
- Only measure of central tendency where the sum of the deviations of each value from the mean will always be zero.
Median - The midpoint of the values after they have been ordered from the smallest to the largest, or the largest to the smallest. There are as many values above the median as below it in the data array.
- Properties of the median
- The median is unique. Only one for a given set of data.
- To determine order the data from low to high or high to low and find the middle value
- It is not affected by extremely large or small values.
- It can be computed for an open-ended frequency distribution, if the median does not lie in the open-ended class. (An open ended class is one that does not have a specific limit. An example would be a class that is stated as: $100,000 or more. How much is "or more"? No one knows where the class ends. This makes it open ended)
- It can be computed for ratio, interval and ordinal level data.
Mode - The value of the observation that appears most frequently.
- Properties of the mode
- Can determine the mode for all levels of data.
- Not affected by extremely high or low values.
- Can be used with open-ended distributions.
- A data set may not posses a unique mode. No mode, one, two, three or more are all possibilities.
- Range - The difference between the largest value and the smallest values in the data.
- Properties of the Range
- Very easy to calculate
- Does not use all the data
- Affected by extreme values
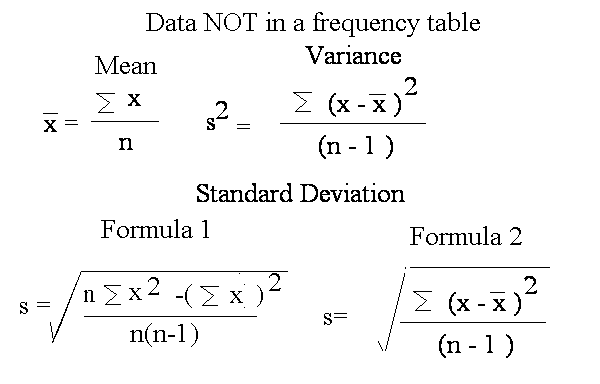
- Variance - The sum of the squared differences from the mean, divided by the number of data points minus one (see example below).
- Standard Deviation - The square root of the variance.
- Properties of the Variance and Standard Deviation
- Commonly used
- Standard deviation used to find Z-scores
- Unique

The formulas shown above tell you how to calculate the mean, variance and standard deviation if you have data that is NOT in a frequency table. To illustrate the use of the formulas assume that we sample the amount of time people wait to get a web connection using their dial-up phone line. If we collect a sample of size 5 (n=5) the data (values of x) in seconds might look as follows: 10, 24, 16, 20 and 10.
To calculate the sample mean we would add all of the values 10+24+16+20+10 and then divide the result by 5 (the number of data points). Since our sum is 80 and we divide it by 5 the mean is 16 seconds.
To calculate the variance or standard deviation when the data is NOT IN A FREQUENCY TABLE we have a choice of two formulas (only one shown for the variance). We will only illustrate the use of formula 1. Using Formula 1 we need to:
- Square each of the x values
- Find the total of those squares
- Multiply the previous total by the number of data points
- Go to the x column and total it
- Square the total of the x column
- Subtract the square of the x column from the sum of the x's squared (from step 3)
- Divide the result from step 5 by the product of the sample size times the sample size minus 1 [n*(n-1)]
- Take the square root of the above result
As an example we would
- Square each of the x's which gives: 100,576, 256, 400 and 100.
- Add all of the x squares which gives: 1,432
- Multiply 1,432 by 5 (the number of data points) giving: 7160
- Add of of the x's which gives:80
- Square the 80 from the previous step: 6,400
- Subtract step 5's result from step 3's result: 7160 - 6400
- Divide 6400 by 5(5-1) giving:320 (Variance)
- Take the square root or 320 giving:17.89 (Standard deviation)
Practice Question 1 - Data not in a freqency table - Assume that you take a sample of the length of time that people wait in line at an ATM machine and record the following values (in minutes): 3, 5, 2, 7, 3. Use this data to calculate the sample mean, standard deviation and variance. (answers at the end of this section)

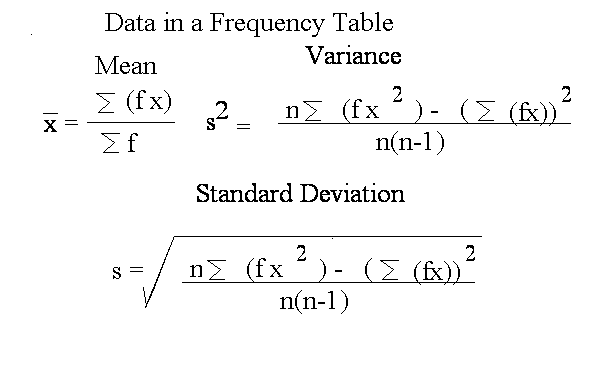
The formulas shown above tell you how to calculate the mean, variance and standard deviation if you have data that is in a frequency table. To illustrate the use of the formulas assume that we take a new and larger sample of the amount of time people wait to get a web connection using their dial-up phone line. Suppose we collect a sample of size 50 and get the data shown in the first and second columns on the table shown below.
| Class (Time) | Frequency | Mid-Point | Freq*Mid-Point | Freq*Mid-Point2 |
| 10 - 14 | 20 | 12 | 240 | 2880 |
| 15 - 19 | 10 | 17 | 170 | 2890 |
| 20 - 24 | 20 | 22 | 440 | 9680 |
| Totals | 50 | No Meaning | 722500 | 772500 |
In the table the first column represents our classes (time), the second column is the frequency for each class, the third column is the class midpoint (upper class limit plus lower class limit divided by 2), the next column is the frequency times the class midpoint and the last column is the class frequency times the square of the class midpoint (ONLY THE CLASS MIDPOINT IS SQUARED!).
To calculate the mean we total the column where we multiplied the class mean times the class frequency: 240 + 170 + 440 = 850. Now you divide 850 by the total the frequency column - 50. The result is 850/50 = 17. This is the mean of our sample data.
To calculate the standard deviation:
- we square the class mid-points, then multiply those each squared class mid-point by its class frequency. Finally we total the resultant column.
- Now multiply the above value by the sum of the frequency column (50). This gives you (2880 + 2890 +9680) times 50 which equals 772500. (Last column in the table)
- Now take the total of the frequency times midpoint column and square that total. This is 240 + 170 + 440 = 850 and then 850 squared is 722500.
- The numerator in our caluculation is 772500 - 722500, or 50000.
- The denominator is the total of the frequency column times itself minus one ; n*(n-1) This is 50*(50-1) = 2450
- All of this is under the square root radical. So, the calculation is Square root(50000/2450) which equals 4.52. 4.52 is our sample standard deviation (s)
Practice Question 2 - Data in a freqency table - Assume that you take a sample of the customers at a local pizza parlor. The data you collect is shown below. Use the data to calculate the sample mean, standard deviation and variance. (answers at the end of this section)
| Customer age | Frequency |
| 0 - 19 | 23 |
| 20 - 29 | 17 |
| 30 - 39 | 18 |
| 40 - 49 | 15 |
| 50 - 69 | 12 |
Chebyshev's Theorem - For any set of observations (sample or population), the minimum proportion of the values that lie within k standard deviations of the mean is at least 1 - 1/k2, where k is any constant greater than 1. For example: assume that the mean of a distribution is 20 and the standard deviation is 5. You want to know the fraction of the data that can be found between 10 and 30. Using a z score format of z = (x - mean)/std dev. you have: (20-10)/5=2 and (30-20)/5=2 so your data points are 2 standard deviations above and below the mean. Using Chebyshev's rule you have % = 1 - 1/22. Simplifying you have % = 1 - 1/4 = 3/4 = 0.75 or 75%. 75% of the data will lie between 10 and 30.

1.0 Given: A normal distribution with a mean of $50 and a standard deviation of $5
What % of the population will lie between a value of $40 and a value of $60. To determine this we must first determine how many standard deviations $40 and $60 are from the mean. To do this we calculate (value - mean)/standard deviation.
- for the value of $40 we have (40-50)/5 = -2 (two standard deviations below the mean)
- for the value of $60 we have (60-50)/5 = 2 (two standard deviations above the mean)
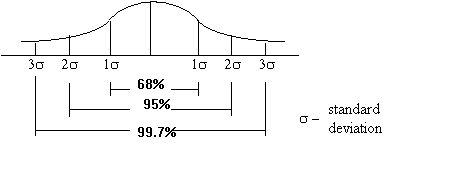
The values of $40 and $60 are plus and minus two standard deviations from the mean. Looking at the Empirical Rule figure (above) you find that 95% of the population will be within plus or minus two standard deviations of the mean.
2.0 Given: A normally distributed population has a mean of 35 and a standard deviation of 3.
What values will mark the upper and lower limits for 68% of the population. From the Empirial Rule figure we see that 68% of the population will be within plus or minus one standard deviation of the mean.
- one standard deviation below the mean would be 35-3 = 32
- one standard deviations above the mean would be 35 + 3 = 38
- The upper and lower limits we seek are 38 and 32 respectively.
All of these measures address the issue of where the data point is in relation to the rest of the data. Z Score tells you how many standard deviations above or below the mean a given value of x is located. Quartiles divide the data into quarters, deciles divide the data into tenths and percentiles divide the data into hundredths.
- Z Score - z = (x - xbar)/s (sample)
- Quartiles - Use formula on page 96 of text: k = 25, first quartile, k=50, second quartile, k=75, third quartile
- Deciles - use formula on page 96 of text: k = 10, 20, 30, 40, 50, 60, 70, 80 or 90
- Percentile - use formula on page 96 of text: k= any integer from 1 to 100
Answers to practice quesitons
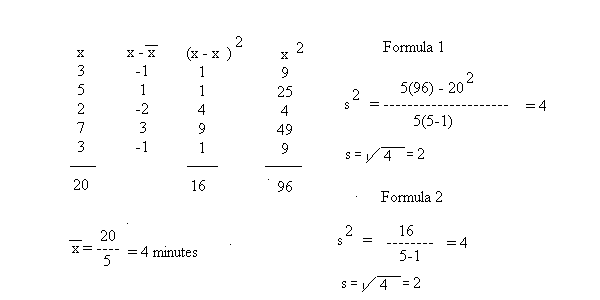
Question 1 - Data values (in minutes): 3, 5, 2, 7, 3.
Mean
- To get the mean add all of the values 3 + 5 + 2 + 7 + 3 = 20
- Now divide the total by the number of data points: Sample mean = 20/5 = 4 minutes
Standard Deviation - Method 1

Question 2 - Data in a freqency table, shown below. Calculate the sample mean, standard deviation and variance.
Ages of Customers Customer age Frequency Class Mid. Pt. freq*Mid. Pt. freq*Mid. Pt.2 0 - 19 23 9.5 218.5 2075.75 20 - 29 17 24.5 416.5 10204.25 30 - 39 18 34.5 621.0 21424.5 40 - 49 15 44.5 667.5 29703.75 50 - 69 12 59.5 714.0 42483.00 Totals 85 ------ 2637.5 105891.25
- Mean = 2637.5/85 = 31.03 years (rounded)
- Variance = [85(105891.25) - (2637.5)2] / [ 85(85-1)] = 286.32 years squared
- Stanandard Deviation = Square root (286.32) = 16.92 years